2D-Graphik-Control
Version 1
Copyright © 1999, by Jürgen Eder
Date: 20. Feb. 2005
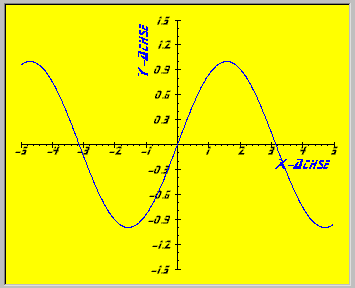
Via this 2D-Graphic-Control equations (for example: sin(x) ) or truth tables can quite simply drawn. In one coordinate system any number of equations and truth tables – also mixed – are possible.
Content
This version is FREEWARE. You can use it on your own risk.
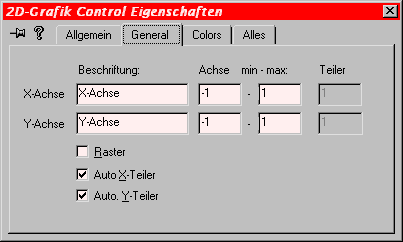
In this dialog you can setup the most important parameters (for x and y axis separately):
labels (“Beschriftung”)
dimensioning of the axis (minimum and maximum)
divider (“Teiler”) or an automatic divider (“Auto X-Teiler” / “Auto Y-Teiler”)
grid (“Raster”)
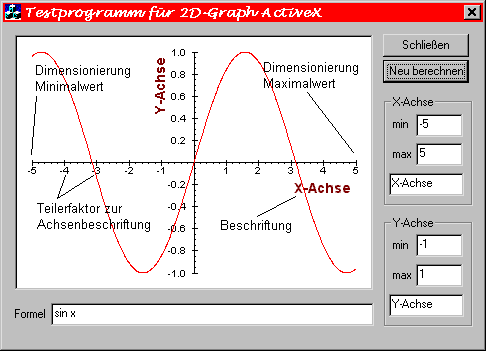
The next picture show a small example (installed with the control):
Syntax
short Appearance
Description
Draw a box around the output. This property depends also from BorderStyle!
|
Appearance |
BorderStyle |
Description |
|
0 |
0 |
no box |
|
1 |
0 |
3D box |
|
0 |
1 |
2D box (only a black bounding box) |
|
1 |
1 |
3D box |
Syntax
COLORREF BackColor
Description
Change the background color. COLORREF is a RGB value.
Syntax
short BorderStyle
Description
Set the look of the bounding box. It depends also from Appearance.
|
Appearance |
BorderStyle |
Description |
|
0 |
0 |
no box |
|
1 |
0 |
3D box |
|
0 |
1 |
2D box (only a black bounding box) |
|
1 |
1 |
3D box |
Syntax
BOOL Grid
Description
|
TRUE |
Draw some dashed lines over the output area |
|
FALSE |
Draw only the divider near the x/y axis |
The divider of the grid will be set by XDelta and YDelta property. Also the divider may be calculated by the control if XautoDelta and/or YAutoDelta are set to TRUE.
Syntax
char *XText
Description
Caption of x axis. This is an optional setting.
Syntax
char *YText
Description
Caption of the y axis. This is an optional setting.
Syntax
double XMaximum
Description
Maximum value of the x axis
Syntax
double XMinimum
Description
Minimum value of the x axis
Syntax
double YMaximum
Description
Maximum value of the y axis
Syntax
double YMinimum
Description
Minimum value of the y axis
Syntax
BOOL XAutoDelta
Description
If TRUE, the x divider will be automatically calculated by the control.
Syntax
BOOL YAutoDelta
Description
If TRUE, the y divider will be automatically calculated by the control.
Syntax
COLORREF Color
Description
Color of the coordinate system. COLORREF is a RGB value.
Syntax
double XDelta
Description
Divider of the x axis for the grid.
Note
Has no effect if XAutoDelta is set to TRUE
Syntax
double YDelta
Description
Divider of the y axis for the grid
Note
Has no effect if YAutoDelta is set to TRUE
Syntax
BOOL MMTwipsModus
Description
Experimental, do not use
Syntax
char *BFont
Description
Font name for coordinate system
Note
To label the coordinate system you can use two fonts:
- optional caption of x- and y-axis: BFont
- for labeling divider or grid: WFont
The divider will be always labeled!
Syntax
char *WFont
Description
Font name for divider and / or grid
Note
To label the coordinate system you can use two fonts:
- optional caption of x- and y-axis: BFont
- for labeling divider or grid: WFont
The divider will be always labeled!
Syntax
COLORREF BFontColor
Description
Color of coordinate system caption
Syntax
short BFontHeight
Description
Font height of coordinate system caption
Syntax
short WFontHeight
Description
Font height of divider labels
Syntax
BOOL BFontBold
|
TRUE |
fat |
|
FALSE |
normal |
Description
Font option for the coordinate system caption
Syntax
BOOL BFontItalic
|
TRUE |
italic |
|
FALSE |
normal |
Description
Font option for the coordinate system caption
Syntax
BOOL WFontBold
|
TRUE |
fat |
|
FALSE |
normal |
Description
Font option for the divider labels
Syntax
BOOL WFontItalic
|
TRUE |
italic |
|
FALSE |
normal |
Description
Font option for the divider labels
Syntax
BOOL WFontTransparent
|
TRUE |
Background will not changed (transparent mode) |
|
FALSE (default) |
Background will be cleared before writing text |
Syntax
char *Function
Description
Any mathematical function will be accepted e.g. "1/x*sin(x)" is valid property.
Only one function can be set as a property all other functions must be set by the methods of this control. The control set the id number of this function to 0.
Syntax
COLORREF FunctionColor
Description
Color for the function with the id number 0. (see above: Function)
Syntax
char *Separator
Description
With the function AddTableFromFile you can load text files which includes X-Y values. But before you can load a file with AddTableFromFile you must set the separator character. This can be a semicolon, a comma, a tab, ...
Note
The control will use only the first character of the given string
Syntax
char *TableFile
Description
File name of a text file with x-y values. Every line with a X-Y pair in the file generate a new entry in the truth table. The separator character should set before with the property: Separator. The control set the identifier of this truth table to 0. See also: AddTable
Syntax
short XAxisMode
Description
Position of the x axis
|
Mode |
X Axis |
|
0 (default) |
normal |
|
1 |
always at bottom |
|
2 |
always at top |
Syntax
short YAxisMode
Description
Position of the y axis
|
Mode |
Y Axis |
|
0 (default) |
normal |
|
1 |
always at the right side |
|
2 |
always at the left side |
Syntax
short TableDrawMode
Description
Drawing mode of the truth table
|
Mode |
Description |
|
0 (default) |
normal (every point will be merged by a line with the next point) |
|
1 |
draw only points |
Syntax
long TableLinesDontUse
Description
The control read over this number of lines if it read a text file. (for: AddTableFromFile)
Syntax
long TableColAsXAxis
Description
Row of X-Axis if there are more rows in the file (for: AddTableFromFile)
Syntax
long TableColAsYAxis
Description
Row of Y-Axis if there are more rows in the file (for: AddTableFromFile)
Syntax
char *TableXFormula
Description
Formula to calculate the x axis if the ocx read a truth table from a text file.This means, every x value will be first converted by this formula. (for: AddTableFromFile)
Syntax
char *TableYFormula
Description
Formula to calculate the y axis if the control read a truth table from a text file.This means, every y value will be first converted by this formula. (for: AddTableFromFile)
Syntax
void AddFunction(short id, char *function, COLORREF color);
|
Parameter |
Description |
|
id |
any number (1...), the id: 0 is reserved by the property “Function” |
|
function |
mathematical function, e.g. "1/x*sin(x)" |
|
color |
color of this function |
Description
A mathematical function will be calculated and immediately drawn.
Syntax
void DeleteFunction(short id);
|
Parameter |
Description |
|
id |
ID (1...), which was used in "AddFunction" |
Description
The function with the selected ID number will be deleted.
Syntax
void ResetGraph(void);
Description
All functions and all truth tables will be deleted
Syntax
void AddTable(short id, char *name, COLORREF color);
|
Parameter |
Description |
|
id |
any number (1...), the id: 0 is reserved by the property “TableFile” |
|
name |
any name for the truth table |
|
color |
color of this graph |
Description
A new truth table will be created. The x-y values can be set after.
Syntax
void DeleteTable(short id);
|
Parameter |
Description |
|
id |
any ID (1...), which was set in "AddTable()" |
Description
Delete the truth table with the selected ID number.
Syntax
void AddTableEntry(short id, double x, double y);
|
Parameter |
Description |
|
id |
any ID (1...), which was set in "AddTable()" |
|
x |
X value |
|
y |
Y value |
Description
With this function you set one x/y pair into the selected truth table (selection by the the ID number)
Note
The control don't sort the values. All values are shown in the order they are added into the truth table.
Syntax
void AddTableFromFile(char *filename, short id, char *name, COLORREF color);
|
Parameter |
Description |
|
filename |
file name |
|
id |
any ID (1...) |
|
name |
name of the truth table |
|
color |
color of the new graph |
Description
A new truth table will be created and all x/y pairs will be read from the text file (every line there must be one x-row and one y-row). You should set a separator character before with the property "Separator".
Syntax
void ShowPropertyPage(void);
Description
Show the property page
Syntax
void Copy(void);
Description
Copy the graphic as a bitmap into the clipboard
Syntax
void UserDraw(long HDC, long x, long y, long width, long height);
|
Parameter |
Description |
|
HDC |
Graphic device handle from Windows API |
|
x |
x position |
|
y |
y position |
|
width |
width |
|
height |
height |
Description
Use this in your draw function in SDI and MDI applications (e.g. in OnDraw() in MFC apps)